About Me
I’m a Controls Engineer at a paper mill in Pine Bluff, where I design, optimize, and maintain automation systems to keep complex industrial processes running efficiently. Outside of work, I explore side projects that combine engineering, analytics, and creativity - from building interactive blackjack simulations and Monte Carlo models to developing automation tools and experimenting with AI-driven decision-making.
Over the years, these projects have strengthened my skills in data analysis, control system design, software development, and user interface creation, while deepening my understanding of probability, optimization, and problem-solving under real-world constraints.
Learn How to Count Cards in Blackjack
I built this project to get hands‑on experience with HTML, CSS, and JavaScript—and to create something people can enjoy while learning. The focus isn’t to get anyone hooked on blackjack; it’s to demystify the math and mechanics of card counting and show how small edges emerge (and disappear) as the shoe changes.
What you’ll learn
- - How the Hi‑Lo running count and True Count are calculated.
- - Why advantage shifts with decks remaining and shoe composition.
- - How basic strategy + count deviations drive the best move.
- - Risk, variance, and bankroll concepts (incl. Kelly‑style bet sizing).
What I practiced building it
- - Semantic HTML and responsive CSS layout.
- - Modular JavaScript (state, events, fetch for strategy JSON).
- - Live UI with gauges & charts (e.g., credits, win%, suggestion accuracy).
- - Accessibility, performance, and mobile-friendly design.
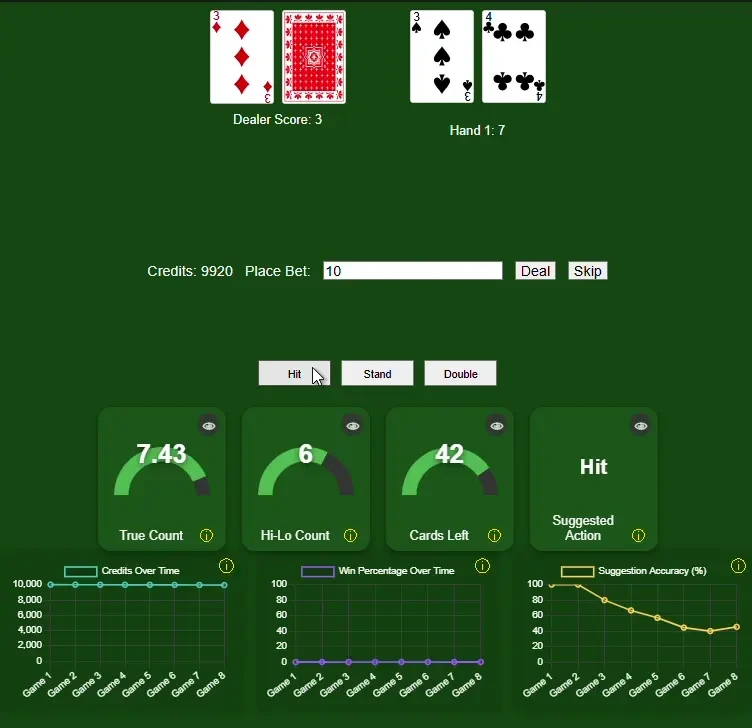
Gauges & Metrics Explained
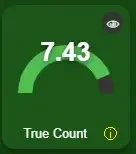
True Count
Formula:
$$ \text{True Count} = \frac{\text{Hi-Lo Running Count}}{\text{Decks Remaining}} $$
Why it matters: It normalizes the running count by shoe depth and is the key driver of advantage and bet sizing (see Kelly below). A common rule of thumb is that each +1 in true count increases player edge by approximately 0.5%.

Hi-Lo Count
How it works: For every 10, J, Q, K, or A, decrease the count by 1. For every 2–6, increase it by 1. (7–9 are neutral.) In practice, higher counts mean more high cards remain, which generally favors the player.
Hi-Lo isn’t the only—and isn’t necessarily the best—system, but it’s popular because it’s simple and effective to learn.

Suggested Action
Recommends the highest-expected value (EV) move (Hit/Stand/Double/Split) based on basic strategy plus count-based deviations. With basic strategy alone the casino keeps a small edge; with count deviations at favorable true counts, the player can gain a slight edge.
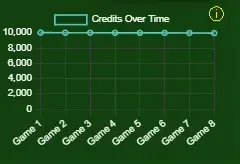
Credits Over Time
Tracks bankroll across hands. With perfect basic strategy, solid deviations, and disciplined bet sizing, this may trend upward over large samples,but variance is real. Probabilities converge over very long runs; in the short run, even perfect play can lose (see risk of ruin).
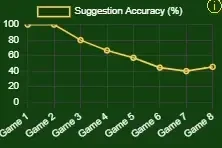
Suggestion Accuracy
Shows how often the chosen action matched the recommended action over time. Even small error rates (e.g., 5%) can meaningfully erode long-term results.
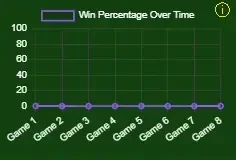
Win Percentage Over Time
With perfect strategy you’ll average ~42% wins, ~9% ties, and ~49% dealer wins. Even with a sub-50% win rate, blackjacks and payout rules mean your expected value hovers near break-even—long-run edge depends on true count and bet sizing.
Interactive SimulatorUnderstand Card Counting—Not Just Play
Kelly Criterion Strategy (Blackjack)
What matters in blackjack isn’t raw win rate (the player only wins ~42% of hands overall) but edge %: the expected value per unit bet. The Kelly Criterion answers: what fraction of my bankroll should I wager to maximize long-run growth?
Classic Kelly (one-bet model)
For a bet that risks 1 to win \(b\) with win probability \(p\) (loss probability \(q=1-p\)), Kelly maximizes the expected log growth
$$ g(f) = p\,\ln(1 + b f) + q\,\ln(1 - f) $$
and yields the optimal fraction
$$ f^{*} = \frac{b p - (1-p)}{b}. $$
For even-money bets (\(b=1\)) this simplifies to \(f^{*} = 2p - 1\). The curve \(g(f)\) is concave: it rises to a single peak at \(f^{*}\). Betting below Kelly lowers growth gently; betting above Kelly is punished hard and can make growth negative.
Why we don’t apply the strict formula in blackjack
Blackjack isn’t a single even-money bet. Outcomes include pushes, 3:2 blackjacks, doubles and splits (±2 units), etc. That mixture widens the distribution of results (typical variance per hand is ~1.2–1.4 under common 3:2 rules), so a single \(p,b\) pair doesn’t capture the game well. In practice, players estimate their edge % from the true count and size bets with the game’s variance:
$$ f^{*} \;\approx\; \frac{\text{Edge (decimal)}}{\text{Variance per hand}}. $$
Rule of thumb for Hi-Lo: \(\text{Edge}(TC) \approx \text{Edge}(0) + 0.5\%\times TC\). If \(\text{Edge}(0)\approx -0.5\%\), then TC +1 ≈ 0%, TC +4 ≈ +1.5%–2.0%. (Exact values depend on rules and strategy deviations.)
Practical sizing
- Bet 0 when Edge ≤ 0 (low/negative counts).
- Increase the fraction as TC (and Edge) rises; typical variance ≈
1.3. - Consider fractional Kelly (e.g., ½-Kelly) to trade a little growth for smoother drawdowns.
Try the interactive widget below: move \(p\) and \(b\) to see the classic Kelly peak, or use the Blackjack quick sizer to map TC → Edge → Kelly. The cyan marker shows the bet fraction implied by your Edge/Variance choice.